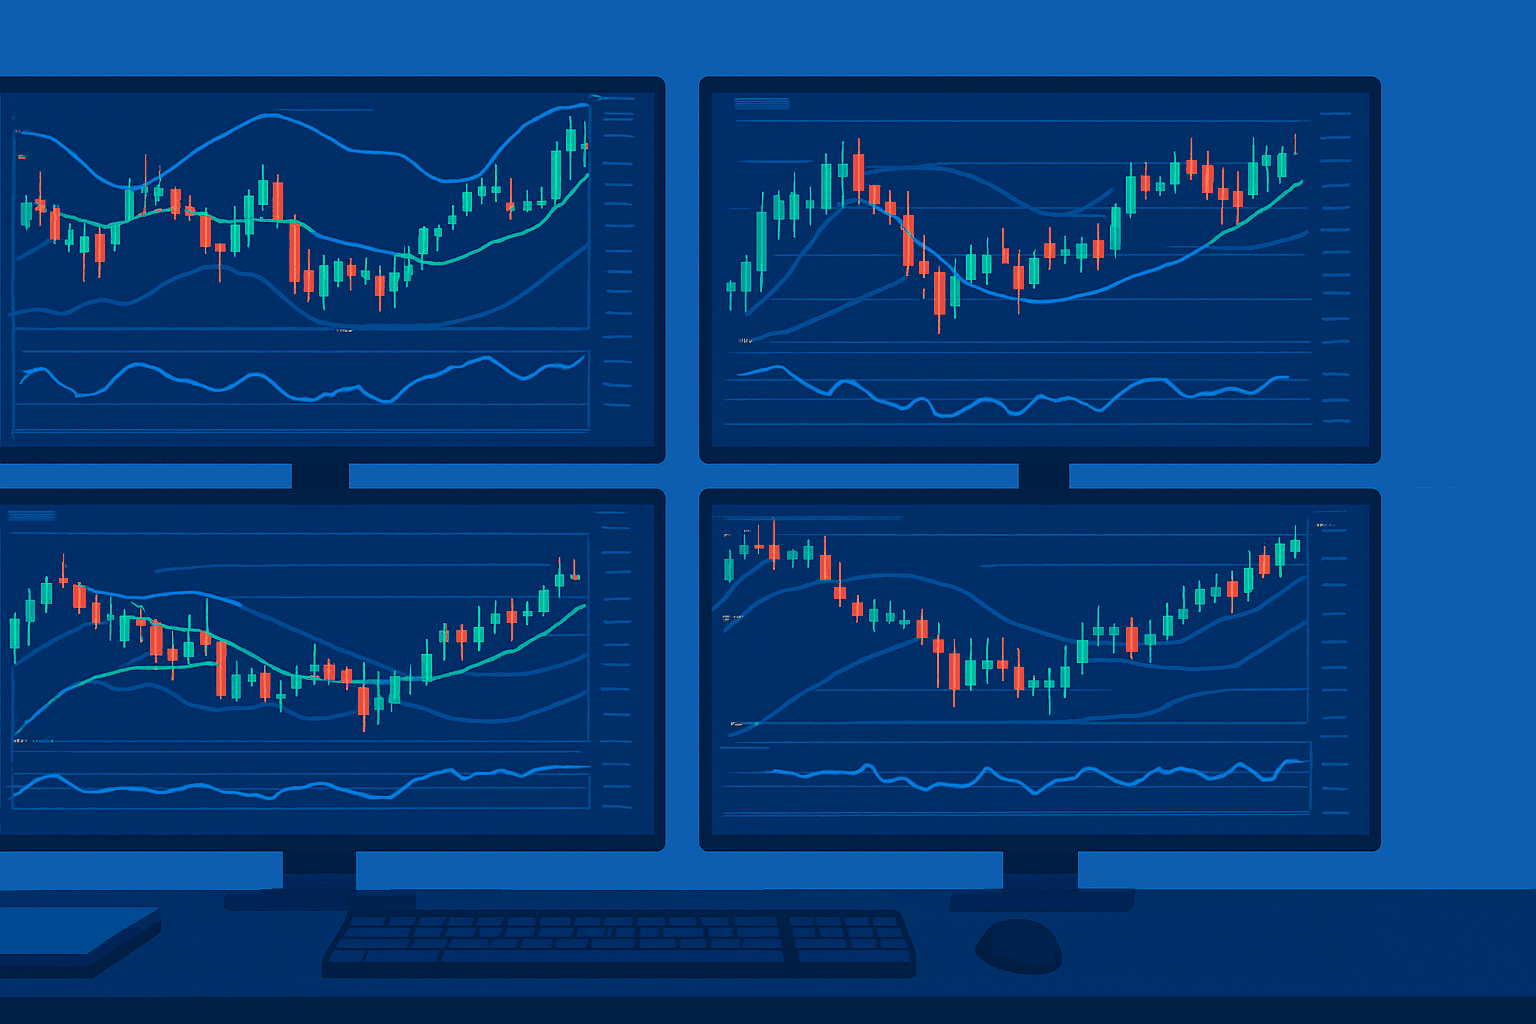
Technical analysis is one of the most valuable tools in a forex trader’s arsenal. Instead of relying purely on instinct or news-driven moves, traders use technical indicators to interpret price action, identify trends, and anticipate market moves. For beginners, understanding the Top 5 Technical Indicators for Beginners can provide a solid foundation for building confidence, improving decision-making, and adding structure to their trading journey.
Here are the top 5 technical indicators every new forex trader should understand:
1. Moving Averages (MA)
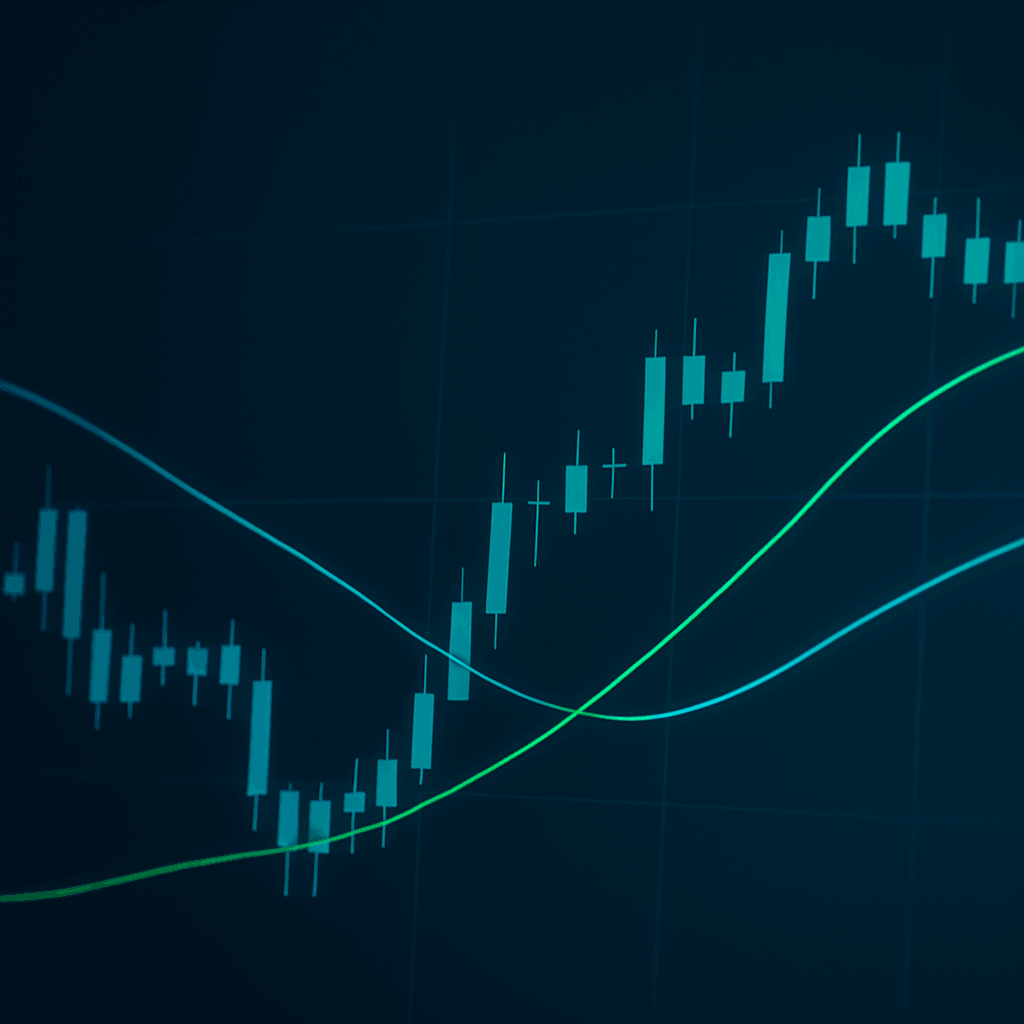
Moving averages smooth out price data, helping traders see the broader trend without being distracted by short-term volatility.
- Simple Moving Average (SMA): Calculates the average price over a set period.
- Exponential Moving Average (EMA): Gives more weight to recent prices, making it more responsive to market changes.
Why beginners love it: MAs are straightforward to use and help traders identify whether the market is trending upward, downward, or sideways. They’re also the building blocks for more advanced strategies like moving average crossovers.
2. Relative Strength Index (RSI)
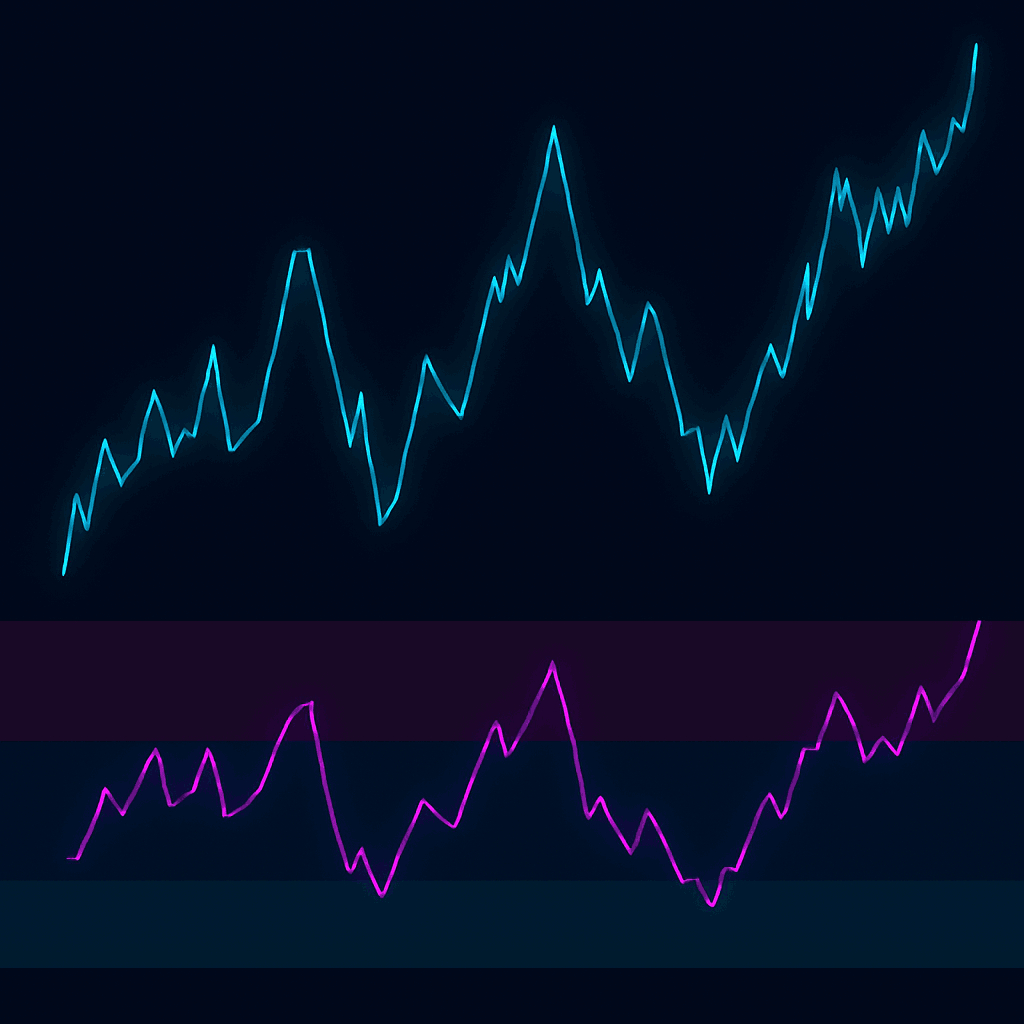
The RSI is a momentum oscillator that measures the speed and change of price movements on a scale of 0 to 100.
- Above 70: The market may be overbought (potential for a pullback).
- Below 30: The market may be oversold (potential for a rebound).
Why it matters: RSI helps beginners avoid buying at the peak of a rally or selling at the bottom of a dip, making it a vital tool for timing entries and exits.
3. Moving Average Convergence Divergence (MACD)
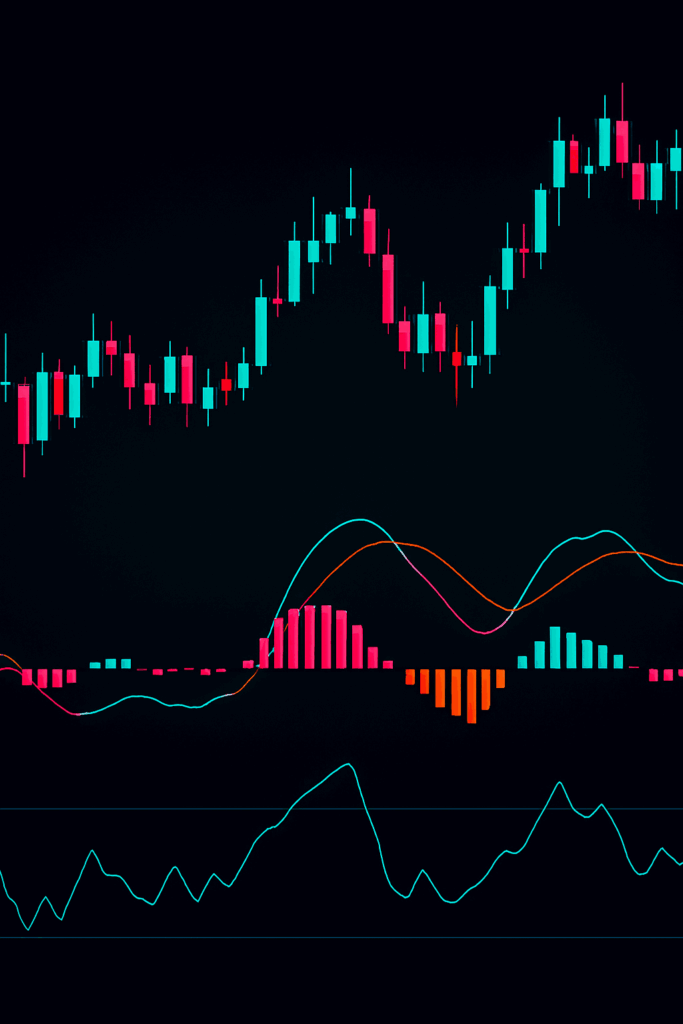
MACD is a trend-following indicator that also measures momentum. It consists of two moving averages and a histogram, which signals the difference between them.
- Bullish signal: When the MACD line crosses above the signal line.
- Bearish signal: When the MACD line crosses below the signal line.
For beginners: MACD provides clear signals that are relatively easy to interpret, making it a go-to tool for spotting potential entry and exit points.
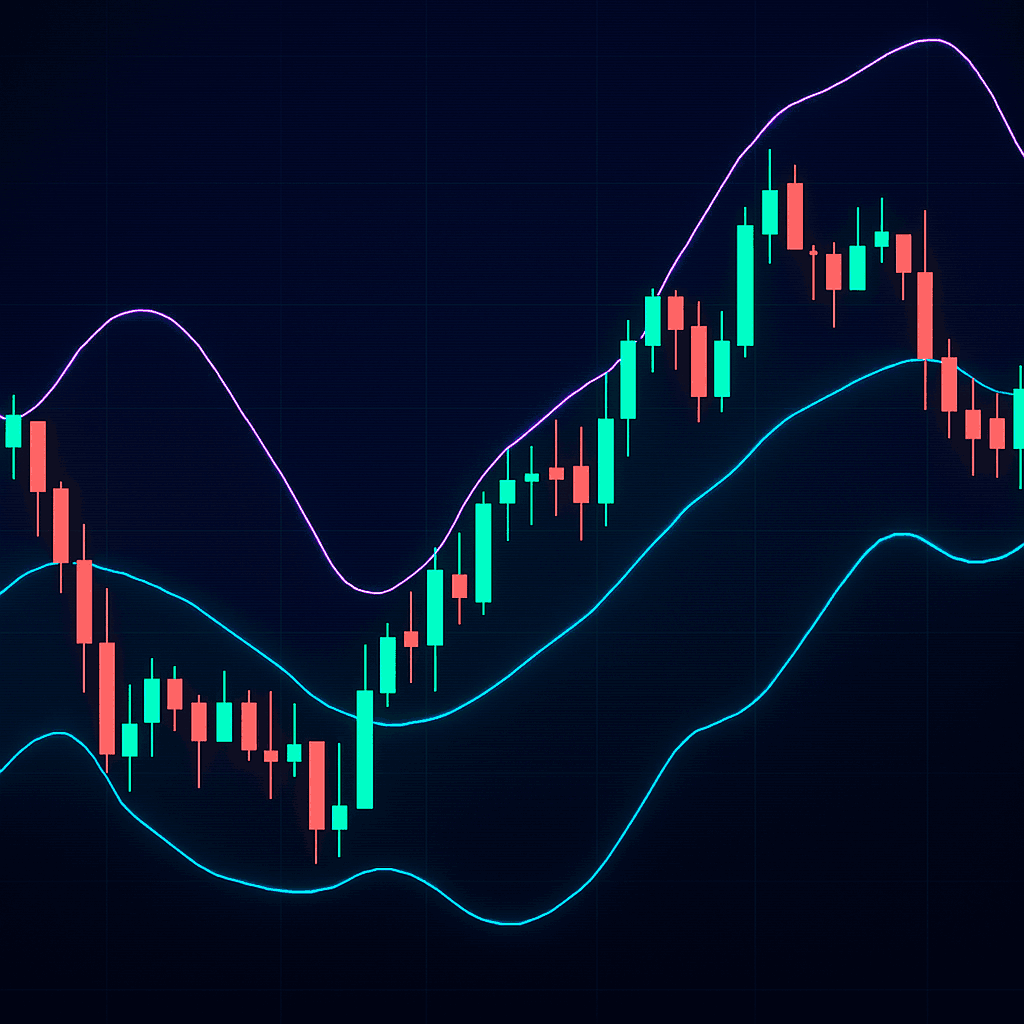
4. Bollinger Bands
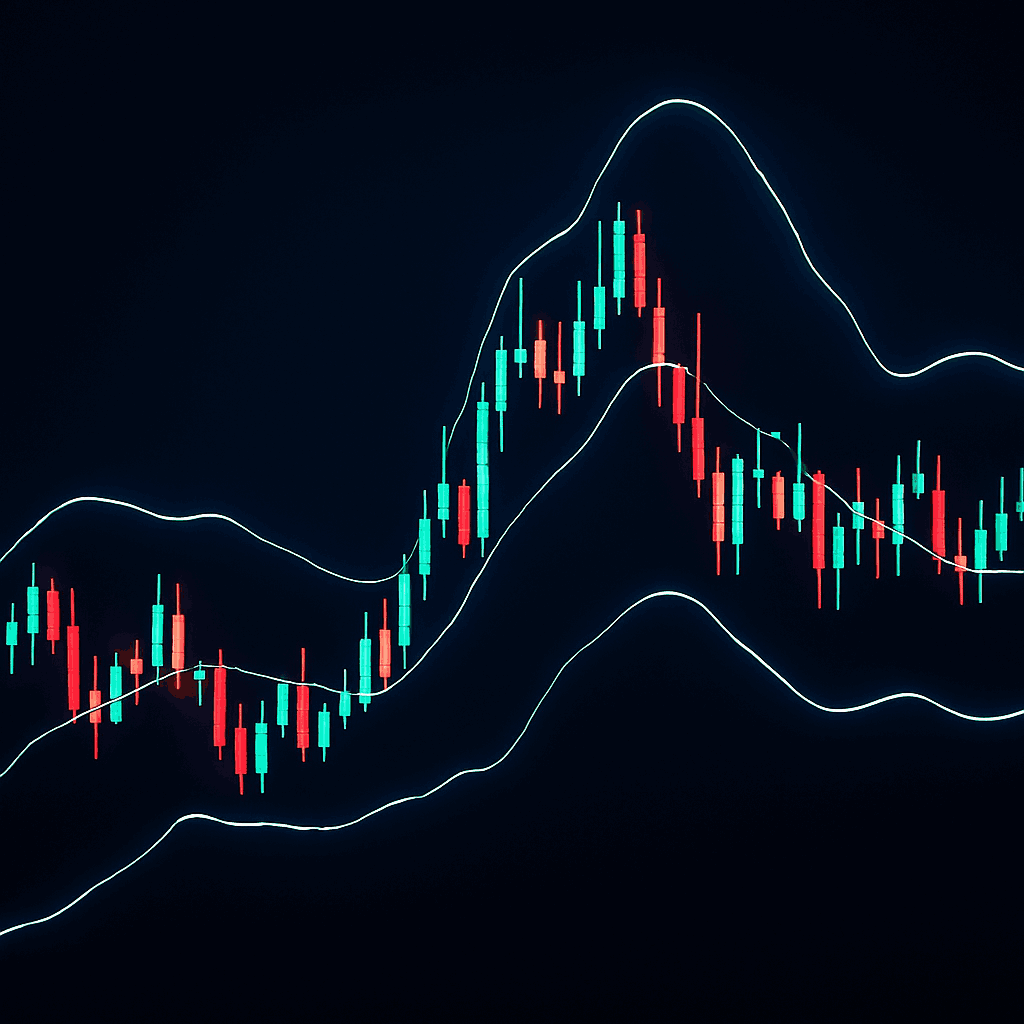
Bollinger Bands consist of a moving average with two standard deviation lines above and below it. These bands expand and contract based on market volatility.
- Price near the upper band: Market may be overbought.
- Price near the lower band: Market may be oversold.
Benefit for beginners: Bollinger Bands help visualize volatility and provide a sense of whether prices are unusually high or low relative to recent trends.
5. Stochastic Oscillator
The stochastic oscillator compares a particular closing price to a range of its prices over a certain period. It’s displayed as two lines (%K and %D) that move between 0 and 100.
- Above 80: Overbought condition.
- Below 20: Oversold condition.
Why it’s beginner-friendly: It’s simple to understand and complements RSI by confirming potential reversals in market trends.
Final Thoughts
For beginners, these five technical indicators Moving Averages, RSI, MACD, Bollinger Bands, and Stochastic Oscillator offer a balanced mix of trend-following and momentum-based analysis. Mastering them provides a strong starting point for building effective trading strategies.
While indicators are useful, it’s crucial to remember that they work best when combined with sound risk management and a disciplined trading plan. Over time, traders can expand to more advanced tools, but these core indicators will always remain essential.